Writing Task1 From IELTS Cambridge 13
Posted: Wed May 30, 2018 12:49 am
My answer:
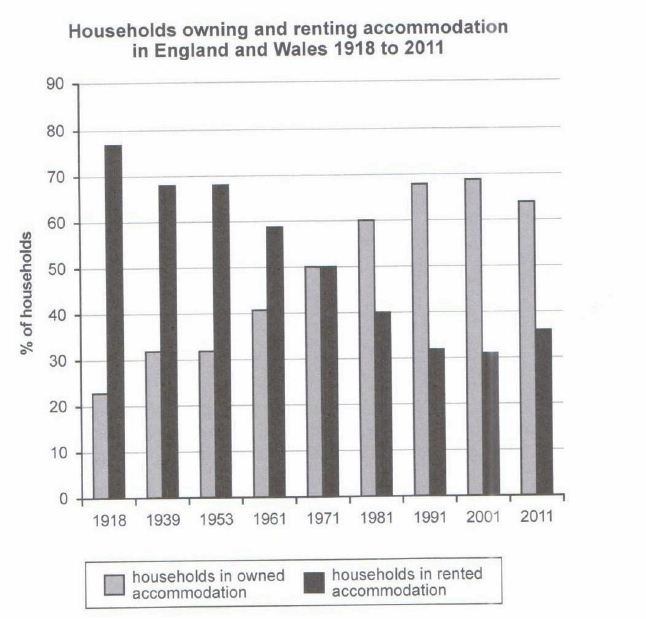
The chart illustrates the proportion of households in owned and rented accommodation in two countries ( England and Wales) between 1981 and 2011.
Overall, the percentage of households in rented accommodation was higher than the percentage of households in owned accommodation over that period. In addition, the highest percentage of households in owned accommodation was in 2001 whilst the percentage of households in rented accommodation was the lowest. On the other hand, the biggest percentage of households in rented accommodation was in 1918 while the percentage of households in owned accommodation was the smallest. Furthermore, households in owned and rented accommodation had the same percentage in 1971.
In terms of the percentage of households in owned accommodation, it was around 23% in 1981. Then, it increased to be around 32% in 1939 and 1953.It considerably increased from 1939 to 2001 (about 32% and 69% respectively). However, it slightly decreased to be around 64% in 2011.
The year 1980 didn't only witness the lowest percentage of households in owned accommodation, but it also witnessed the highest percentage of households in rented accommodation that it was around 86%. It slightly decreased to have the same value (around 68%) in 1939 and 1953. It significantly decreased from around 68% to 31% from 1953 to 2001 . After that, it increased a little to be around 36% in 2011.