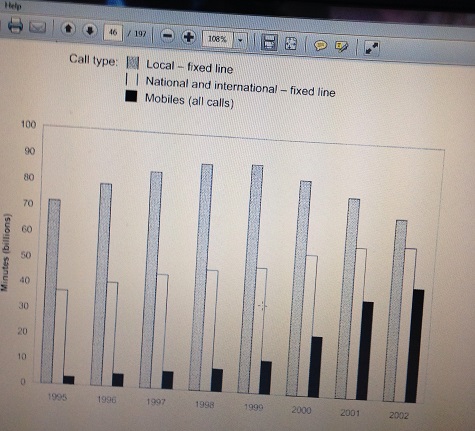
The chart below shows a total number of minutes (in billion) of telephone calls in UK , divided in to three categories from 1995 - 2002 (Cambridge 9 test 2)
This graph shows a volatile number of minutes of telephone in three categories over the course of eight years. A positive correlation between national and mobile calls while local fixed call shows a fluctuate trend.
From 70 billion units in 1995 the local fixed line grows to roughly 90 billion units in 1999 before dropping to almost its original value in 2002. On the other hand, National and International fixed line shows a very steady growth from around 35 billion levels and it shows a modest change till 2000 where it reach approximately 55 billion, after that it finished the year a hair less than 60 billion. Equally, Mobile phone calls also follow the same trend, its begin from 5 billion and provide a gradual increase till 1999, before prior to hitting sharp increase to 40 billion in 2002.
However, comparing the three units of telephone calls of UK, local fixed call achieved the highest minutes over the period although the trend declined at the end where national and mobile calls followed a rise throughout the period
Please evaluate and give band Task 1 bar graph
Re: Please evaluate and give band Task 1 bar graph
Please help me to score my writing and correct me where i m wrong

Re: Please evaluate and give band Task 1 bar graph
Hi,
I can make some comments on your writing. If you can post the graph or a link to it, I can look at your interpretation of it as well. It seems like a good analysis but I can't give you an idea of the band score without seeing the graph.
Hope this helps!
Joe
http://www.ieltschampion.com
This graph shows a volatile/variable number of minutes of telephone calls made? in three categories over the course of eight years. There is a positive correlation between national and mobile calls while local fixed calls show a fluctuating trend.
From 70 billion units of calls made in 1995 the local fixed line grows to roughly 90 billion units in 1999 before dropping to almost its original value in 2002. On the other hand, National and International fixed line shows a very steady growth from around 35 billion levels and it shows a modest change till 2000 where it reach approximately 55 billion, after that it finished the year a hair less/(for a graph analysis, probably better to use 'just less' or 'just under 60 billion') than 60 billion. Equally, mobile phone calls also follow the same trend, it begins from 5 billion and shows a gradual increase till 1999, before a sharp increase to 40 billion in 2002.
However, comparing the three units of telephone calls in the UK, local fixed call achieved the highest minutes over the period although the trend declined at the end where national and mobile calls followed a rise throughout the period
Re: Please evaluate and give band Task 1 bar graph
Hi Joe
Thanks for your reply. i try to attached the file for u but wont be able its taken from Cambridge 9 test 2
Thanks for your reply. i try to attached the file for u but wont be able its taken from Cambridge 9 test 2
Re: Please evaluate and give band Task 1 bar graph
Hi joe i attach the image for u
- Attachments
-
- image.jpg (93.23 KiB) Viewed 1731 times